November 5, 2021 / Esther Choy

Flip board, white board, napkin, notebook…draw a simple visual!
If you took your logo off of your latest pitch deck, could it pass for another company’s? How about your latest presentation at an industry conference?
When you’re competing for audience attention, your visuals are a powerful asset. This is even truer in a virtual environment, where companies can find themselves trying even harder to make a strong impression. Engaging your audience takes thoughtfulness about how our brains work, as expressed by Steven Franconeri, director of Northwestern University’s Visual Cognition Lab: “If you get your visual on the whiteboard, it dominates the meeting.” The right visual can start a meaningful conversation and give your presentation a real impact, one that lingers and spurs action.
Here are three keys to successful visuals you can start using right away.

1. Save the best for never.
The most important visual should not appear in a slide deck at all. Or, as I tell my clients, “Save the best for never.”
Instead of including it in the deck, draw the most important visual in front of your audience. That’s right. If you’re meeting in person, use a flipchart. Or, if you’re presenting your idea with a small group, draw it on a piece of paper or even a napkin. If you’re meeting online, you can still draw! For instance, Zoom, Teams, and many other platforms have basic drawing tools that are well worth investigating and learning.
I have observed the following scene unfold over and over again: when someone picks up a pen or marker to draw something, others pay attention. What will the person draw? The natural reflex is to track and follow how the picture will turn out.
Storytelling is the intentional assertion of your point of view. Getting “your visual on the whiteboard” allows you to share that point of view. Your audience becomes engaged, and they feel invited to share their own perspectives, too. That makes for meaningful conversation.
2. Simple is best.
What can you draw? Stick figures? Circles? Relatively straight lines? Great, use it! You don’t need to move beyond simple shapes as long as you use them effectively.
We use this drawing frequently to illustrate Leadership Story Lab’s personality:
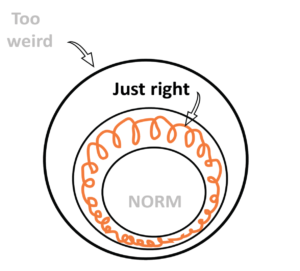
A simple visual for “normal” and “weird.”
As you can see, the circle in the middle—the “norm”—is what’s considered “normal” in people regarding what they say, do, wear, or how they represent themselves. The “too weird” label lands on the outskirts of the diagram. This refers to overly different or unexpected, a territory that makes others uncomfortable, sometimes intentionally. The region we occupy at Leadership Story Lab is somewhere between “normal” and “too weird.” In a group setting, for example, we don’t use classroom-style seating, but we don’t make everyone stand on their heads, either.
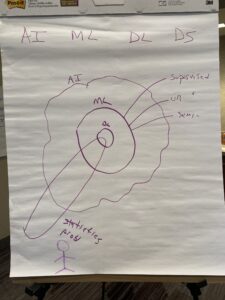
A simple visual for a client.
During a client training session, the senior data scientist drew this picture to illustrate the oft confused terms in the world of data science . AI represents artificial intelligence, ML is machine learning, DL is deep learning, and DS is data science. The DS encompasses AI, ML, and DL, and the use of statistics and probabilities cuts across all three. It’s an extremely simple picture drawn very quickly that illustrated the topics we were discussing.
I dedicated an entire chapter of my book, Let the Story Do the Work, to simple visuals.
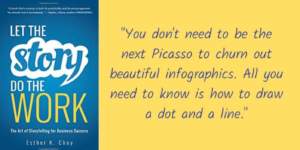
You really don’t need to be Picasso!
3. Practice.
Don’t be fooled by how easy it may seem to use a visual in a story. When you watch a well-told visual story unfold, it will seem impromptu. In reality, most people need to figure out ahead of time what part of the visual goes before or after its corresponding piece of the story for maximum effect, just as a magician must practice a trick countless times to get it just right.
For instance, a client of mine used a visual to clear up a recurring confusion with their client. The company had oil investments in a country with a name that sounded quite similar to a country that was in the midst of a civil war. So what did they do to clear up confusion?
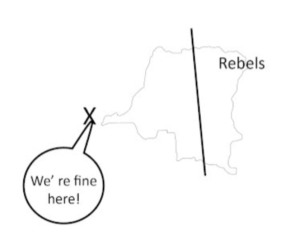
A simple map…maybe takes a little practice.
They drew a simple map of the war-torn country, and then they drew a line through it, demonstrating where the war was occurring: far to the northeast. Significantly, the drawing showed that the investment wasn’t even on the map. Because, after all, it was happening in a completely different country.

This drawing didn’t require an art degree, but it did require some time to conceptualize, and a little practice to get the contours of the country right.
But the more you practice, counterintuitively, the more spontaneous the visual story seems, and the more it will keep the audience glued to your message.
Want a chance to brainstorm and workshop some visuals? We’d love to talk. And why not join us at our next free Story Lab?
Related Articles


Better Every Story
Leadership Transformation through Storytelling
"This is an amazing and insightful post! I hadn’t thought of that so you broadened my perspective. I always appreciate your insight!" - Dan B.
Get Esther Choy’s insights, best practices and examples of great storytelling to your inbox each month.